I think its fair to say that we’ll probably look back on 2019 as one of the better years, or perhaps more accurately the year that surprised us all. Personally I thought, as we are late cycle, it would be a tough year but in reality markets surged ahead even though the global economy (and especially the European economy) sagged.
Here’s SocGen’s quant team on the year overall –
“Equities had an eventful but very profitable 2019, rebounding from a weak 2018, helped by a Fed policy reversal that led to a strong start to the year. Most indices performed quite well, with 70% of stocks in MSCI World posting gains of 10% or more. Yet, this performance went hand in hand with deteriorating economic sentiment, falling interest rate expectations and declining profits. MSCI World delivered a total return of over 28%, with almost all of that coming from P/E expansion, and the decade ended with the index trading at 17x forward EPS, close to its highest forward valuation outside of the tech bubble.”

Analysts at S&P Dow Jones compiled a fascinating series of end of year charts and tables that merit a much closer look. First big fact – IT accounted for 31.3% of the YTD 2019 total return, as Apple and Microsoft accounted for 14.8% (17.8% for MTD December 2019) and 8.45% from 2009

Next up, From 2009, Apple and Microsoft accounted for 8.45% of the total return

Volatility was also historically low with strong market breath

Market breadth

Finally, the US markets continued to outperform – American equities now comprise 53.5% of global markets, up from 41.1% in 2009

Factor Olympics
Nicholas Rabener at Factor Research has also crunched the numbers for which styles of equity outperformed in 2019. You can see the full report here – https://www.factorresearch.com/research-factor-olympics-q4-2019?mc_cid=2b68fb9465&mc_eid=d8376c4e49
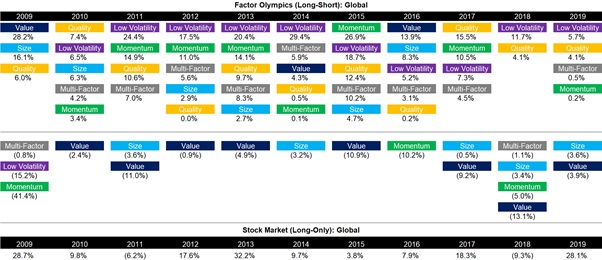
Rabener’s main observations are as follows:
- Value & Low Volatility: “There is no structural relationship between these two factors from a historical perspective, but in 2019 these behaved liked polar opposites, which was especially apparent from May onward, where Low Volatility generated strongly positive and Value significantly negative returns.”
- “There was a significant rotation from Momentum, Quality, and Low Volatility into Value in September 2019, but this was short-lived and no structural shift in the trend of the Value factor performance seems to have occurred.”
Retail funds
Last but by no means least Willis Owen has looked at how these big-picture numbers impacted fund returns in the UK.
First up the top-performing fund sectors in the UK followed by the inevitable pack of dogs.
Growth equity funds seemed to be in the ascendant with absolute returns funds trailing a very long way behind…..again.
10 best-performing sectors
| Investment Association Sector | Percentage Return |
| Technology & Telecommunications | 310.88 |
| North American Smaller Companies | 279.55 |
| North America | 248.61 |
| Japanese Smaller Companies | 246.59 |
| UK Smaller Companies | 245.71 |
| European Smaller Companies | 179.07 |
| Global | 149.15 |
| Global Equity Income | 143.71 |
| Japan | 141.40 |
| UK All Companies | 129.78 |
Source: FE Analytics, performance from 31st December 2009 to 31st December 2019 in pounds sterling on a total return basis
10 worst-performing sectors
| Investment Association Sector | Percentage Return |
| Targeted Absolute Return | 26.45 |
| Global Bonds | 50.98 |
| Mixed Investment 0-35% Shares | 52.14 |
| Global Emerging Markets Bonds | 58.68 |
| Specialist | 59.21 |
| UK Gilts | 64.74 |
| Sterling Strategic Bond | 64.96 |
| UK Direct Property | 66.88 |
| Mixed Investment 20-60% Shares | 67.23 |
| Global Emerging Markets | 68.23 |
Source: FE Analytics, performance from 31st December 2009 to 31st December 2019 in pounds sterling on a total return basis
Leave a Reply