The FTSE 100 is back in the red again. We’ve finally seen a decisive move below 7000 – not a great surprise to me – and we may see more selling as investors worry about Facebook/Eurozone recovery/weak retailers. Arguably a more relevant consideration is the exchange rate, with sterling having moved equally decisively above $1.40 to the £. Again, I’m not surprised as I thought that the Brexit sell-off had been overcooked. Sure, Brexit is going to be challenging but it’s hardly the end of the world. Some sort of deal will, probably, be reached, and the FX markets will move on to worrying about other things (Corbyn?). An equally powerful force – again, much commented on in this blog – is that the dollar might weaken, considerably. All in all, a weaker dollar and a stronger pound is probably bad news for blue-chip equities in the FTSE 100, largely because of their bountiful foreign earnings.
It’s even possible that sterling could strengthen from here on in. That’s the view of Charles Ekins, a strategist who runs money using ETFs (he’s ex ValuTrac). This morning he put out a note which suggests that using his system sterling doesn’t look remotely ‘overbought’ – unlike at the beginning of this year. The first chart below sums up this view.

Ekins also looks at other signals, including the deviation in the spot rate from its trend level. This reached a very high level in January at 2 standard deviations (green circle below). Similarly, following the setback in Sterling over the past few weeks, this is also not flashing overbought.

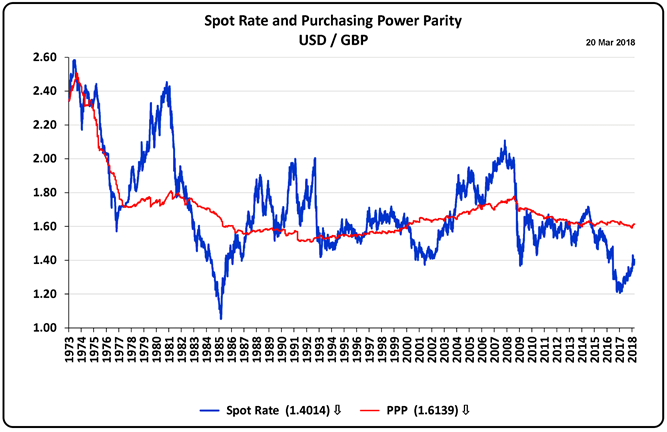
Crucially, at the fundamental level, sterling at around 1.40 “is still cheap versus the USD. Purchasing Power Parity (red line below) is around USD 1.61”:

Last by no means least Ekins reckons that sterling remains in a clear “uptrend against the US Dollar”.

If Ekins is right – and I think he might well be – we could see sterling strengthen over the next few weeks, with a possible near-term target of $1.45…which feels about right to me. Crucially we might also see sterling stay in a tight $1.35 to $1.45 trading range over a prolonged period of months. This might have a big impact on the blue chip global stocks in the FTSE 100. If that is the case we could see the FTSE decline in absolute terms – possibly below 6700 – but also in relative terms against the S&P 500. The last chart below shows returns from the FTSE 100 (in black and red) against the S&P 500 (bright orange), over the last year. The outperformance of the S&P 500 is quite remarkable. If tech stocks survive their current wobble, we could this gap widen even further. At some point – with a Corbyn win looking unlikely, and a Brexit deal looming – we might expect UK equities to be regarded as dirt cheap compared to their global peers.

Leave a Reply