Why I own shares in MSCI but I’m also thinking about switching into S&P Global. And the different kinds of global indices tracked by ETFs
About 18 months ago I started buying shares in global index provider MSCI. The average price has been around $351 and the shares are currently trading at around $526. Why did it buy into MSCI?
First off let me explain the table below. It’s what I call my basis point portfolio. It consists of a bunch of financial businesses that are in effect the plumbers of modern finance. They all take a few basis points off every transaction. Some do this obviously such as Visa and Mastercard, who still sit on an oligopolistic position within the payments system. Others take their basis points less obviously. The London Stock Exchange for instance charges for transactions on its exchange. But for me, the most lucrative basis point charges are for intellectual property. More specifically for providing an index to an exchange-traded fund issuer.
This is as close to alchemy as you can get. Build up an index until it turns into a brand and then charge fund managers copious fees for a) tracking the index and b) accessing underlying data for the index. You can even charge c) for using the brand in your marketing. Obviously, there’s some continuing work involved with managing this index but if I’m honest, a small room full of people plus a big computer can do most of the hard work. So, margins in the index business are high – very high. My guess is that gross margins are probably over 70% with net margins above 50%. And you don’t need me to tell you, dear reader, that the ETF business is booming. So, the first point is that running indices is hugely lucrative, especially if you’ve invested a long time in building a well-known index such as the S&P 500 or the MSCI Emerging Markets Index or the FTSE All-Share index.

My second point though is equally important. ETFs on the S&P 500 and other well-known indices are legion and usually low cost. That means that the index companies can usually only charge a handful of basis points for something famous like the S&P 500. But the real money is to be made in coming up with newer, more complex indices that are required to power the rise of alternative investing ideas. These more complex, or newer indices generally charge more in basis point fees – anything from 5 to 50 basis points depending on the complexity. And the fastest growing area of all is in ESG indexing. I am an open critic of ESG or environmental, social and governance-based indices. I’m not convinced they add much value and I think their methodology is questionable in many instances. BUT that does not mean that I think ESG investing is going away. Quite the opposite in fact. ESG investing is booming despite critics like me lambasting it at every opportunity. In fact, I would go so far as to say it’s boom time in ESG index land, with policymakers and regulators jumping on the bandwagon, demanding that public companies measure everything from their carbon footprint to how they manage corporate governance. And dominant within that ESG index space is MSCI. It faces strong competition from the likes of S&P Global but if I am honest, at the moment, MSCI is regarded as the go-to place for ESG indices. Again, I may think this drive to index the net-zero transition is flawed but MSCI, partly through clever acquisitions, has positioned itself in a prime position.
All of which helps explain the first graphic below. This is sourced from Sharepad and shows four lines. The black line is the share price since autumn 2019. The green line is the S&P 500 while the red line is the 20-day moving average and the blue line is the 200 day moving average. The outperformance versus the S&P 500 is staggering. I’ll come back to the moving average question at the end.

The next chart, also from Sharepad, gives us a quick financial summary. The PE ratio is looking a tad extravagant at 57 times forecast earnings but take a look at that earnings growth – its predicted to grow ESP by 27% and sales by just under 20%. The return on capital employed is 26%.

So, lets summarise why I bought into MSCI..
- MSCI is a classic fintech plumbing stock that takes a large number of small basis points off the fastest-growing bit of the investment world
- MSCI is also dominant in the ESG space, which is growing gangbusters
- MSCI is also highly profitable with very high net margins and a high ROCE
- MSCI is also, in essence, a high beta stock on the growth of the S&P 500 index. If US equities do well, MSCI will do well.
BUT that remarkable share price outperformance is now looking a tad vulnerable. Look at the next chart below which is again from Sharepad and shows the consensus analysts’ estimates for MSCI. You’ll see that on average the consensus opinion is just outperform, with at least 5 analysts rating it either a hold or sell (versus 6 a buy or outperform). This slightly concerns me. I sense that investors accept the bull case but reckon that the share price is probably too high on classic valuation grounds. The elevated valuation also doesn’t allow for any possible future controversies around say ESG indices are constructed (and why so many oil companies seem to get through the environmental screens).

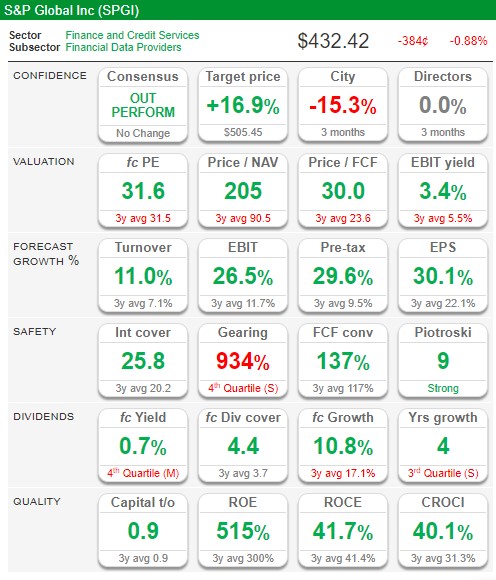
I think we can see some of that nervousness in the current share price which is below both the 20 and 200 day moving average. All of which brings me to the last chart below which shows the key financial metrics for S&P Global. The forecast PE ratio for S&P Global is much, much lower at 31.6 times earnings while Return on capital employed is still impressive at 41%. But S&P Global isn’t growing as fast as MSCI. Turnover is only expected to grow by 11% in the coming year although EPS is likely to be increasing by 31%. It’s also worth noting that S&P Global’s share price is still well above its 200 day moving average.
My hunch is to switch from MSCI to S&P Global and accept that I’ll have a less focused business (S&P also has a range of nonindex businesses), with a slightly slower growth profile, but better valuation metrics.
Understanding Global Equity Indices
Rather than buy lots of different developed world markets (the US, Europe, and Japan for instance) why not buy into one fund that tracks a big, well-known index of nearly all the developed world’s stock markets? That’s the idea behind a small band of comprehensive indices – and ETFs – which represent a compelling proposition for private investors. Within one ETF an investor can buy aggregate exposure to the major large caps in all the big, developed world markets.
Two choices await. The first is the index you track – we’ve featured five global index series but most ETFs tend to track the MSCI version which is the market leader. The second choice is whether to buy into this index so that it includes the UK (the default choice for most) or excludes the UK market – if you decide the latter, you might then buy into a separate FTSE All-Share or FTSE 100 tracker. Note also that these global indices only track equities – not bonds – and are focussed on developed world markets and blue chips in particular.
In our book, the main indices are as follows, all of which are market cap weighed, are dominated by large cap stocks and involve either purely developed world stocks or an additional smattering of emerging market (EM) stocks:
- MSCI World Index : The MSCI World Index captures large and mid-cap representation across 23 Developed Markets (DM) countries*. With 1,546 constituents, the index covers approximately 85% of the free float-adjusted market capitalization in each country.
- MSCI ACWI Index: The MSCI ACWI captures large and mid cap representation across 23 Developed Markets (DM) and 25 Emerging Markets (EM) countries*. With 2,966 constituents, the index covers approximately 85% of the global investable equity opportunity set
- S&P Global 1200: The S&P Global 1200 provides efficient exposure to the global equity market. Capturing approximately 70% of global market capitalization, it is constructed as a composite of 7 headline indices, many of which are accepted leaders in their regions. These include the S&P 500® (US), S&P Europe 350, S&P TOPIX 150 (Japan), S&P/TSX 60 (Canada), S&P/ASX All Australian 50, S&P Asia 50 and S&P Latin America 40.FTSE All-World Index
A market-capitalisation weighted index representing the performance of the large and mid-cap stocks from the FTSE Global Equity Index Series and covers 90-95% of the investable market capitalisation. - FTSE All World Index: The FTSE All-World Index is a market-capitalisation weighted index representing the performance of the large and mid cap stocks from the FTSE Global Equity Index Series and covers 90-95% of the investable market capitalisation. The index covers Developed and Emerging markets and is suitable as the basis for investment products, such as funds, derivatives and exchange-traded funds.
- Dow Jones Global Titans 50 Index
Designed to measure multinational companies whose blue-chip stocks are traded on the major exchanges of countries covered by the Dow Jones Global Indices (DJGI) benchmark family.
Let’s look at each of the major indices in turn.
MSCI World Index
The most popular index is called the MSCI World Index. The name of this index is a little misleading because it doesn’t include emerging market countries. It does, however, include around 1546 stocks drawn from 23 countries. Here’s a table of the biggest constituents from 2022:
Percentage of index broken down by country and sector
| Country or Region | Weight(%) | Sector | Weight(%) |
| US | 69 | Financial Services | 13.17 |
| Japan | 6.24 | IT | 23 |
| UK | 4.05 | Consumer Discretionary | 12.2 |
| France | 3.2 | Health | 12.63 |
| Canada | 3.26 | Industrials | 10.21 |
The table illustrates the big problem with global index investing. You end up with a large weighting towards US stocks. That reflects the reality that the US stock market is still by far the largest in the world by value.
The index is also biased towards large-caps. That said, investing in an ETF tracking this index would still diversify you away from the UK market, and most investors should have at least some exposure to US equities. So, we think backing this index might work for some people.
MSCI ACWI Index
Next up we have another index from the same company called the MSCI ACWI Index (All country World index). This index is similar to the MSCI World index except it adds in around 850 extra stocks from 25 emerging market countries. Emerging market stocks account for around 12% of the value of the fund.
Percentage of index broken down by country and sector from 2021
| Country or region | % of index | Sector | % of index |
| US | 61 | Financial services | 13.86 |
| Japan | 5.54 | IT | 23 |
| China | 3.62 | Consumer Discretionary | 12.4 |
| UK | 3.6 | Healthcare | 11.69 |
| Canada | 2.9 | Industrials | 9.64 |
Thanks to the 12% exposure to emerging markets, the index is a bit more diversified than the main MSCI World index. But the US still accounts for more than 60% of the index, which is probably too large a weighting if all your money was invested in this index.
FTSE All World index
Moving away from MSCI we also have the FTSE All World index. This index covers both developed and emerging markets. It comprises around 4094 stocks from 47 different countries and represents over 90% of the global stock market.
Percentage of index broken down by country and sector from 2021
| Country or region | % of index | Sector | % of index |
| US | 51.1 | Financial services | 4.27 |
| Eurozone | 10.7 | IT | 24 |
| Japan | 8.4 | Healthcare | 11.2 |
| UK | 5.9 | Consumer Products | 3.37 |
| Asia – emerging | 5.4 | Industrials | 11.6 |
Dow Jones Titans 50
Finally, we have the Dow Jones Titans 50. This index comprises fifty of the largest global stocks. It’s very heavily slanted towards the US. In our opinion, this index is arguably a more interesting way of getting large cap global exposure in a more concentrated, riskier fashion. For the more adventurous, this is our favourite global index.
Percentage of index broken down by country and sector from 2021.
| Country or region | % of index | Sector | % of index |
| US | 82 | IT | 45 |
| UK | 2 | Consumer Goods | 13.9 |
| Switzerland | 4.8 | Healthcare | 13.2 |
| Taiwan | 2.2 | Consumer services | 12.6 |
| South Korea | 2 | Financials | 7.5 |
What to watch out for
Our general preference is to buy an ETF that invests globally but which avoids the UK – we suspect that most investors are already rather too biased towards UK stocks and so a World ex-UK index should fit the bill.
What’s even better in our view is that all of these indices are very diversified – you’re buying into a portfolio of companies where the top 3 companies usually only comprise between 5 and 9% of the total holdings. There is one downside though – you are buying a heavy mix of US stocks which comprise between 50 and 80% of total holdings. This may worry some UK investors worried about exposure to the US although we’d say it’s simply a reflection of what actually happens on the global equity markets. If you want to buy exposure in a slightly more balanced way, you could assemble an ETF portfolio that included an FTSE All UK tracker, a Eurozone tracker (the Eurostoxx 50) and a US benchmark index such as the S&P 500 – all in equal portions.
Alternatively, if you’re looking for a little more diversification you could build a very simple four index portfolio tracking say the MSCI World, a FTSE tracker, an MSCI Emerging Markets index fund and a global government bonds fund. Bundle up these four funds and you’d have a diversified multi-asset, international portfolio on the cheap – the combined expense shouldn’t be more than 0.4% per annum.
In terms of returns I’ve summarised year by year numbers for the three major MSCI global indices below, which includes the MSCI EM index.
Year |
MSCI World |
MSCI EM |
MSCI ACWI |
2021 |
22.35 |
-2.22 |
19.04 |
2020 |
16.50 |
18.69 |
16.82 |
2019 |
28.40 |
18.69 |
27.30 |
2018 |
-8.23 |
18.88 |
-8.93 |
2017 |
23.07 |
-14.24 |
24.62 |
2016 |
8.15 |
37.75 |
8.48 |
2015 |
-0.32 |
11.60 |
-1.84 |
Leave a Reply