First off, some headline numbers from S&P Dow Jones on equity markets globally. For March, global markets were up 0.78% for the month, and excluding the U.S.’s 1.28% decline, they were up 0.21%. For the three-month year-to-date period, global markets were up 11.62%, and excluding the U.S.’s 13.47% return, they were up 9.58%; for the one-year period, global markets were down 0.23%, and excluding the U.S.’s 6.63% gain they were down 7.19%. Emerging markets were up 1.56% for the month, up 10.06% for the three-month year-to-date period, and off 837% for the one-year period. Developed markets were up 0.69% for the month (0.-0.17 ex-the U.S), up 11.80% (9.43%) for the three-month year-to-date period, and up 0.75% (-6.90%) for the one-year period.
According to SG’s quant team, the
“first quarter of 2019 proved highly profitable for global investors with both equity and bond markets performing strongly. Global equity markets rose 12.6% in total return terms and global 10+ year bonds were up 3.7%, delivering the best-combined bond + equity return since 3Q10. While most of the global equity performance came in January, positive performance was also seen in February and March. Meanwhile, March saw the sharpest decline in global government bond yields since the aftermath of the Brexit referendum in June 2016 but note that although global bond yields are once again plummeting, there is still some way to go before they hit the 2016 lows. Given the slump in bond yields and the general decline in economic growth expectations, it is perhaps surprising that equity markets have been so strong. However, quarterly periods in which global bond and equity markets both rally are quite common; 44% of quarters fit the description since 1988, or 34% since 2000 even though it is widely accepted that the bond/equity correlation turned negative again since that marker. Less common are periods in which both bond and equities lose money at the same time at around 10%; sadly, this tends to be the case during the worst quarters for equities, i.e., diversification fails when you most need it.”
What about inflows and outflows for funds? Deutsche USA’s take – more outflows.
“Equity funds have continued to see large outflows, particularly from the US and Europe. This is in keeping with historical behavior when yields are falling, as flows move into bonds and out of equities. Japan and EM equity funds which had seen strong inflows in Q4, continued that run in the first few weeks this year but have also given way to outflows since mid-February. Across sectors, the only recipients of inflows in Q1 have been the defensives: Real Estate, Telecom, Healthcare, Utilities, and min-vol funds. All cyclical sectors have been seeing outflows, with Financials and Energy bearing the brunt while those out of Technology have been more modest. Across styles, Value funds have continued to see large outflows but those from Growth funds have stopped.”
So, this is a price not funds flow rally in equities.
Analysts at DWS Investments ask a slightly different question.
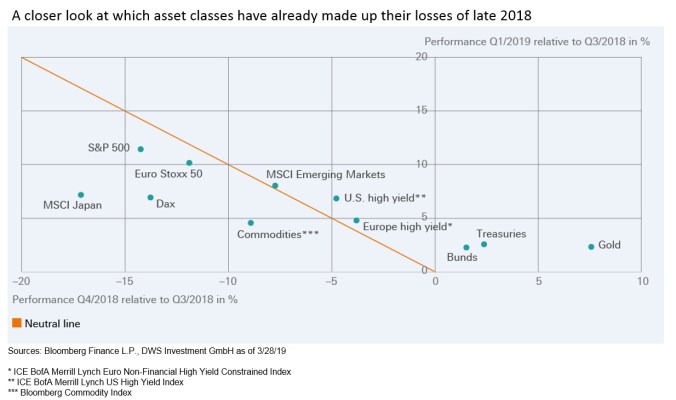
Looking at the various asset classes, which ones have made up for their losses from late 2018? The answer is not as many as you think, with most markets continuing to trade below September 2018 levels.
“Comparing major equity indices, emerging markets were the only ones to fully recover the losses of the fourth quarter of 2018 [my emphasis]. Corporate-credit-indices’ performance exceeds the previous losses, too. Commodities, while up year-to-date, on average remain below their September prices. Safe-haven investments, like sovereign bonds, were the top performers: after their strong run in the fourth quarter 2018, they continued to deliver a positive performance so far this year, producing positive returns in excess of pure coupon income. Gold was performing best: the yellow metal’s price rose strongly in late 2018, and kept going up this year.”
Leave a Reply